File:1850- Warming stripes - global average surface temperature.svg
Vai alla navigazione
Vai alla ricerca

Dimensioni di questa anteprima PNG per questo file SVG: 800 × 450 pixel. Altre risoluzioni: 320 × 180 pixel | 640 × 360 pixel | 1 024 × 576 pixel | 1 280 × 720 pixel | 2 560 × 1 440 pixel | 1 200 × 675 pixel.
File originale (file in formato SVG, dimensioni nominali 1 200 × 675 pixel, dimensione del file: 10 KB)
| Questo file e la sua pagina di descrizione (discussione · modifica) si trovano su Wikimedia Commons (?) |
Dettagli
| Descrizione |
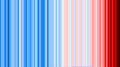
English: Warming stripes graphic showing global average surface temperature starting in 1850
|
| Data | |
| Fonte | Opera propria |
| Autore | RCraig09 |
Related files
-
 20190705 Warming stripes - Berkeley Earth (world) - avg above- and below-ice readings.png
PNG predecessor (early version, not using ColorBrewer hues) -
 1850- Warming stripes - global average surface temperature.svg
SVG successor -
 20190705 Warming stripes BEHIND line graph - Berkeley Earth (world).png
PNG predecessor (early version, not using ColorBrewer hues) -
 20240311 Warming stripes BEHIND line chart - global surface temperature.svg
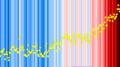
SVG - warming stripes behind conventional line chart -
 20240625 Global warming across generations - warming stripes.svg
warming stripes juxtaposed with generations in history -
 Generation_timeline.svg
2020-, relevant to siming of different generations
_-_avg_above-_and_below-ice_readings.png)

.png)


Licenza
Io, detentore del copyright su quest'opera, dichiaro di pubblicarla con la seguente licenza:
Questo file è disponibile in base alla licenza Creative Commons Attribuzione-Condividi allo stesso modo 4.0 Internazionale
- Tu sei libero:
- di condividere – di copiare, distribuire e trasmettere quest'opera
- di modificare – di adattare l'opera
- Alle seguenti condizioni:
- attribuzione – Devi fornire i crediti appropriati, un collegamento alla licenza e indicare se sono state apportate modifiche. Puoi farlo in qualsiasi modo ragionevole, ma non in alcun modo che suggerisca che il licenziante approvi te o il tuo uso.
- condividi allo stesso modo – Se remixi, trasformi o sviluppi il materiale, devi distribuire i tuoi contributi in base alla stessa licenza o compatibile all'originale.
Cronologia del file
Fare clic su un gruppo data/ora per vedere il file come si presentava nel momento indicato.
| Data/Ora | Miniatura | Dimensioni | Utente | Commento | |
|---|---|---|---|---|---|
| attuale | 06:58, 12 mar 2024 | | 1 200 × 675 (10 KB) | RCraig09 | Uploaded own work with UploadWizard |
Pagine che usano questo file
La seguente pagina usa questo file:
Utilizzo globale del file
Anche i seguenti wiki usano questo file:
- Usato nelle seguenti pagine di en.wikipedia.org:
- Usato nelle seguenti pagine di eo.wikipedia.org:
- Usato nelle seguenti pagine di gl.wikipedia.org:
- Usato nelle seguenti pagine di ro.wikipedia.org:
- Usato nelle seguenti pagine di uk.wikipedia.org: