File:GHG per capita 2000.svg

File originale (file in formato SVG, dimensioni nominali 940 × 477 pixel, dimensione del file: 1,98 MB)
| Questo file e la sua pagina di descrizione (discussione · modifica) si trovano su Wikimedia Commons (?) |
Dettagli
| Descrizione |
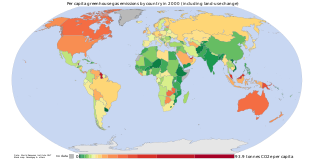
Greenhouse gas emissions per capita in 2000 Data from the World Resources Institute's CAIT 4.0 database (registration required). Includes CO2, CH4, N20, PFCs, HFCs and SF6. Estimates of the effects of land-use change are included; bunker-fuel emissions are not. The land-use estimates include the following (list from the relevant CAIT data note):
Also from the CAIT data note: "It is also important to note that the calculated flux of carbon does not explicitly include changes in carbon stocks that may result from various forms of management. Examples of what is not included are agricultural intensification, fertilization, the trend to no-till agriculture, thinning of forests, changes in species or varieties, and other silvicultural practices." And the data note warns that "these estimates of national sources and sinks of carbon from land-use change are uncertain on the order of +/- 150% for large fluxes, and +/- 50 MtC/yr for estimates near zero." So CAIT's land-use estimates are a bit wild. They are, however, the best currently available at a national level. |
| Data | 03/9/07 |
| Fonte | self-made using data from the World Resources Institute and a blank map by Canuckguy and others |
| Autore | Vinny Burgoo |
Licenza

|
È permesso copiare, distribuire e/o modificare questo documento in base ai termini della GNU Free Documentation License, Versione 1.2 o successive pubblicata dalla Free Software Foundation; senza alcuna sezione non modificabile, senza testo di copertina e senza testo di quarta di copertina. Una copia della licenza è inclusa nella sezione intitolata Testo della GNU Free Documentation License. |
| Questo file è disponibile in base alla licenza Creative Commons Attribuzione-Condividi allo stesso modo 3.0 Unported | ||
| ||
| Questo tag di copyright è stato aggiunto nell'ambito dell'aggiornamento della licenza dei progetti Wikimedia. |
Cronologia del file
Fare clic su un gruppo data/ora per vedere il file come si presentava nel momento indicato.
| Data/Ora | Miniatura | Dimensioni | Utente | Commento | |
|---|---|---|---|---|---|
| attuale | 22:32, 16 set 2007 | | 940 × 477 (1,98 MB) | Vinny Burgoo | 3 or 4 countries in wrong colour band (incl China): corrected. |
| 23:25, 31 ago 2007 |  | 940 × 477 (1,98 MB) | Vinny Burgoo | Per capita greenhouse gas emissions by country in 2000 including land-use change. The data was compiled by the World Resources Institute from several sources. I used Canuckguy's version of someone else's blank map. This update corrects the colour of the | |
| 01:54, 30 ago 2007 |  | 940 × 477 (1,98 MB) | Vinny Burgoo | {{Information |Description=Per capita greenhouse gas emissions by country (including land-use change) |Source=self-made |Date=30/8/07 |Author= Vinny Burgoo }} |
Pagine che usano questo file
La seguente pagina usa questo file:
Utilizzo globale del file
Anche i seguenti wiki usano questo file:
- Usato nelle seguenti pagine di ar.wikipedia.org:
- Usato nelle seguenti pagine di bg.wikipedia.org:
- Usato nelle seguenti pagine di bn.wikipedia.org:
- Usato nelle seguenti pagine di bs.wikipedia.org:
- Usato nelle seguenti pagine di de.wikipedia.org:
- Usato nelle seguenti pagine di en.wikipedia.org:
- Usato nelle seguenti pagine di es.wikipedia.org:
- Usato nelle seguenti pagine di fr.wikipedia.org:
- Usato nelle seguenti pagine di gu.wikipedia.org:
- Usato nelle seguenti pagine di hi.wikipedia.org:
- Usato nelle seguenti pagine di hu.wikipedia.org:
- Usato nelle seguenti pagine di id.wikipedia.org:
- Usato nelle seguenti pagine di ja.wikipedia.org:
- Usato nelle seguenti pagine di no.wikipedia.org:
- Usato nelle seguenti pagine di pa.wikipedia.org:
- Usato nelle seguenti pagine di pl.wikipedia.org:
- Usato nelle seguenti pagine di pt.wikipedia.org:
- Usato nelle seguenti pagine di ta.wikipedia.org:
- Usato nelle seguenti pagine di te.wikipedia.org:
- Usato nelle seguenti pagine di th.wikipedia.org:
- Usato nelle seguenti pagine di tr.wikipedia.org:
- Usato nelle seguenti pagine di uk.wikipedia.org:
- Usato nelle seguenti pagine di vi.wikipedia.org:
- Usato nelle seguenti pagine di zh.wikipedia.org: