File:Blastcurves psi.svg

File originale (file in formato SVG, dimensioni nominali 600 × 400 pixel, dimensione del file: 73 KB)
| Questo file e la sua pagina di descrizione (discussione · modifica) si trovano su Wikimedia Commons (?) |
Dettagli
| Descrizione |
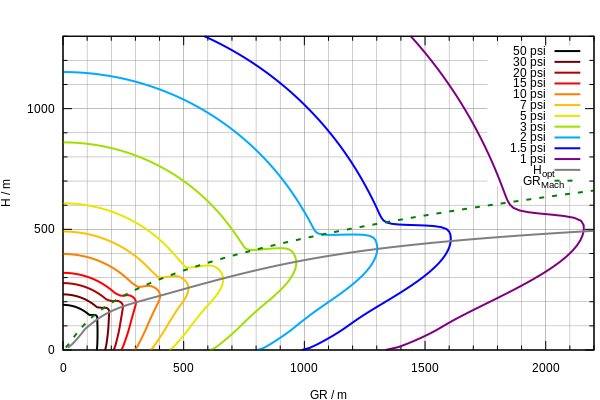
English: Overpressure ranges from 1 to 50 psi (6.9 to 345 kPa) of a 1 kiloton air burst as a function of burst height. The thin grey curve indicates the approximate optimum burst height for a given ground range.
Deutsch: Abhängigkeit des Druckpegels einer 1-Kilotonnen-Explosion von Entfernung und Detonationshöhe. Die dünne graue Kurve gibt näherungsweise die optimale Detonationshöhe an. |
| Data | Created: 21 November 2008 |
| Fonte | Opera propria |
| Autore | SiriusB |
| Altre versioni | Image:Blastcurves_1.png |
Additional Info
Plotted with Gnuplot 4.2.2. Isobars are based on numerically solved formulae from the internal help pages of the BLAST software, the H_opt curve is an analytical fit using the inversely plotted formula

This function should fit both BLAST output and Figures 3.73a-c taken from Glasstone, Dolan, The Effects of Nuclear Weapons, 1977 (EoNW77) as a compromise. Both sources differ slightly. EoNW77 shows the maximum low-pressure ranges at somewhat lower altitudes whereas for high pressures >40 psi BLAST shows no optimum altitudes at all (see the innermost isobar). However, since numerical fitting of curves taken from a paper would be a Sisyphean task while BLAST already outputs plottable numbers, only isobars from the latter are plotted here.
A note on the new version on June 6 2022: The interpolation between the Mach zone and the regular reflection zone has been altered in order to steepen the "knees". This provides a better fit to the Figures 3.73a-c in EoNW77 where the relation of GR to H is actually not unique but features local minima at the onsets of the "knees" for intermediate overpressures. In addition, contours for 1.5, 7 and 15 psi have been added.
Why psi?
Most sources, e.g. Glasstone & Dolan (1977) or Carey Sublette's Nuclear Weapon Archive use pounds per square inch as pressure units. As a rule of the thumb, e.g. most non-reinforced buildings are destroyed for overpressures above 5 psi. However, the pressures can easily be converted into SI units, e.g. kilopascals, where 1 psi = 6.8947573 kPa or, roughly, one psi equals seven kPa.
Additional notes
A note on Gnuplot SVG terminal: Set size variable as "fixed" (the default in Gnuplot), not "dynamic", to ensure correct aspect ratio. This was the reason for uploading a 2nd version.
Licenza
| Io, detentore del copyright su quest'opera, la rilascio nel pubblico dominio. Questa norma si applica in tutto il mondo. In alcuni paesi questo potrebbe non essere legalmente possibile. In tal caso: Garantisco a chiunque il diritto di utilizzare quest'opera per qualsiasi scopo, senza alcuna condizione, a meno che tali condizioni siano richieste dalla legge. |
Cronologia del file
Fare clic su un gruppo data/ora per vedere il file come si presentava nel momento indicato.
| Data/Ora | Miniatura | Dimensioni | Utente | Commento | |
|---|---|---|---|---|---|
| attuale | 15:46, 6 giu 2022 | | 600 × 400 (73 KB) | SiriusB | Modification of the Mach-to-Regular reflection zone interpolation.This steepens the |
| 12:46, 21 nov 2008 |  | 600 × 400 (75 KB) | SiriusB | {{Information |Description= |Source= |Date= |Author= |Permission= |other_versions= }} | |
| 12:40, 21 nov 2008 |  | 512 × 341 (75 KB) | SiriusB | {{Information |Description={{en|1=Overpressure ranges from 1 to 50 psi (6.9 to 345 kPa) of a 1 kiloton air burst as a function of burst height. The thin grey curve indicates the approximate optimum burst height for a given ground range.}} {{de|1=Abhängig |
Pagine che usano questo file
La seguente pagina usa questo file:
Utilizzo globale del file
Anche i seguenti wiki usano questo file:
- Usato nelle seguenti pagine di de.wikipedia.org:
- Usato nelle seguenti pagine di en.wikipedia.org:
- Usato nelle seguenti pagine di ms.wikipedia.org: